
When I first saw the grand canyon, my eyes were overwhelmed by the scale– my brain could not compute how immense this canyon was. Read more Perspective
When I first saw the grand canyon, my eyes were overwhelmed by the scale– my brain could not compute how immense this canyon was. Read more Perspective

This post is not an attack on you or how you live your life, if you disagree with the Bible, feel free to skip this article entirely. I still love you. If you have any questions about God or his unconditional love for you, please email me at joe@primoweb.com.
Read more Should a Christian tell their children what to think about gender issues?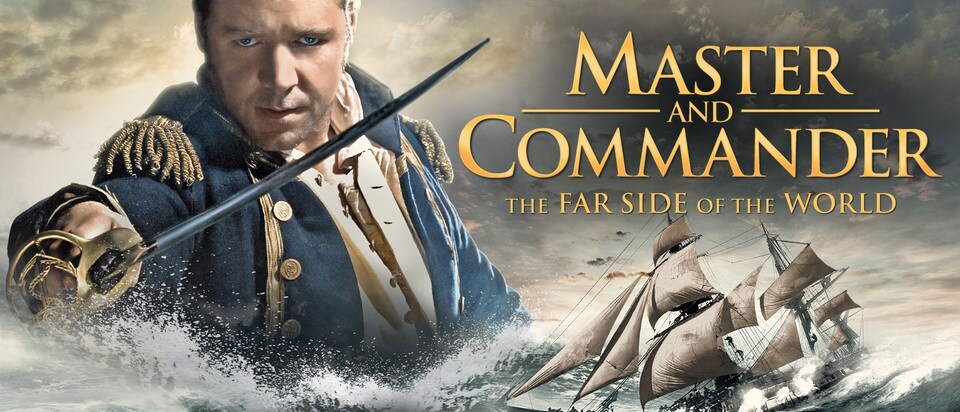
Episode 3 of our “Best YouTube Documentaries” series features a documentary titled “Thomas Cochrane: Craziest Sea Captain in History” by the fantastic “Kings And Generals” channel. The video runs 1 hour & 17 minutes and does include less than 2 minutes of advertising at the very beginning. The video covers the entire life of Thomas Cochrane, who was featured in the movie “Master and Commander: The Far Side of The World” (Starring Russell Crowe). If you’ve seen that movie, you’ll know Thomas Cochrane was in interesting captain, but the Hollywood film doesn’t even scratch the surface. This Documentary left me wondering why Hollywood didn’t make that film into a franchise. In this review, we’ll cover Kings and Generals video style, cover some of the highlights of the film, and provide a couple of ways to watch.
Read more Best YouTube Documentaries Episode 3: Thomas Cochrane, Craziest Sea Captain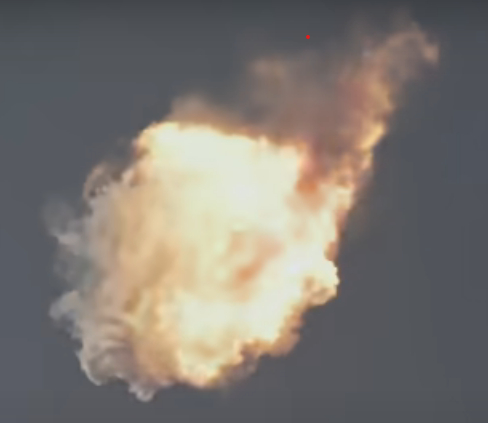
I’ve chatted with many of you in person about the Starship (Ship 24) launch I went to go see on April 20th (2023). Many folks I talk to ask me about whether or not I was sad about the “failure” of the rocket. I wanted to give you all a glimpse of what all of this is like from my perspective. I’m going to tell you a bit about how big of a space nut I am, then, we’ll talk about how watching rockets has changed over the past few years, and lastly, I’m going to tell you about what I expected and experienced at the Ship 24 launch on April 20th.
Read more Being a fan of rocket launches is not what it used to be… and that’s awesome.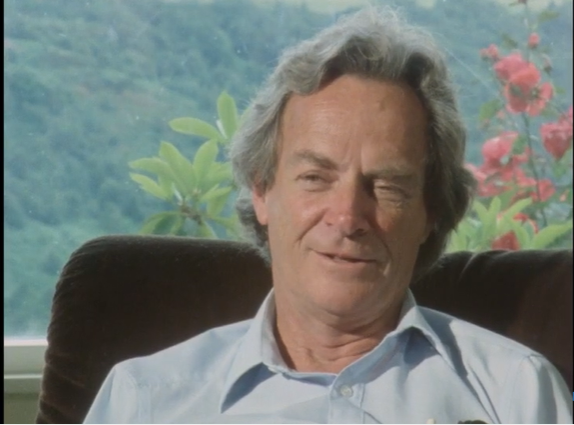
If you haven’t seen or read anything by Richard Feynman, this is an excellent way to begin loving this brilliant man’s ability to communicate. I often wish I had had the opportunity to have been one of his students.
Read more Richard Feynman: The pleasure of finding things out (Documentary)

I’ll accept and tolerate your way of life 99% of the time (unless you’re a murderer or something).You are a human and you have as much right to this planet as anyone else. I won’t necessarily teach my kids that the things you do are acceptable for them, or that they’re allowed in my house. Read more Different strokes
This is an excellent video about the atomic bomb.. hosted by a familiar voice.

“I want to believe.” That phrase may elicit thoughts of UFO or paranormal investigators, or perhaps someone with a crisis of faith. Many would probably not be willing to publicly utter such a phrase, for fear of being thought of as “less than logical”, or even a nut. Read more I want to believe
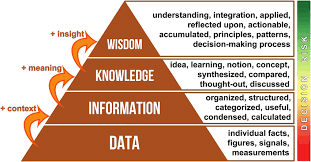
Read more The pyramid of information, or the telephone game?