Updated stats and trends from the US and around the world,
This report has been tracking daily changes to infection totals for the COVID-19 outbreak worldwide. Unfortunately, due to unforeseen circumstances, it was not possible to provide a report for 03/24. The report below covers 2 days worth of changes, but percentages have been normalized (basically averaged) to provide a “daily increase percantage”, for comparison to earlier reports.
For the 48 hours of 03/24 and 03/25 worldwide infections have increased:
| Country | Rank | Daily Growth* | Infections | Prior Infections* | Deaths |
| China | 1 | 0% | 81,736 | 81,552 | 3,291 |
| Italy | 2 | 8% | 74,386 | 63,927 | 9,362 |
| US | 3 | 22% | 69,197 | 46,438 | 1,046 |
| Spain | 4 | 19% | 49,515 | 35,136 | 3,647 |
| Germany | 5 | 13% | 37,323 | 29,056 | 206 |
| Iran | 6 | 8% | 27,017 | 23,049 | 2,077 |
| France | 7 | 13% | 25,604 | 20,123 | 1,333 |
| Switzerland | 8 | 10,909 | Not Tracked | 153 | |
| UK | 9 | 9,640 | Not Tracked | 467 | |
| S, Korea | 10 | 1% | 9,241 | 9,037 | 131 |
| World | 11% | 472,790 | 381,598 | 21,353 |
*Infection totals as of 12:01 am on 03/24
The US Saturation date is now 05/05.
Comments:
New countries are starting to slip into the ranks as South Korea falls lower on the list. South Korea death tolls do stand out as being low, so we’ll keep tracking them. Switzerland and the UK are now on our list, however, we’ve not yet began to track historical information on those countries.
The US finally has broken a week long trend of 30%+ daily growth in confirmed cases, which is one number that could be used to signal an improving condition. A plethora of other factors could play into the growth numbers lowering (for example. if labs have again hit their limit of daily tests).
Another way to look at this information is via the “US Saturation Date” which has moved out several days to 05/05. The date has previously been around April 20-25. This is a substantial move and a good trend.
US Details:
New York City and the surrounding area are driving the US total infection count, as 20,011 cases are in New York city alone, and if we include the nearby areas, the total swells to well over 30,000 cases and over 320 deaths. This area represents roughly 43% of all US infections and 31% of all deaths. Other metros of note with 1000 or more infections include: Boston, Seattle, Detroit, and Los Angeles.
My home state of Oklahoma now has 164 confirmed cases and 6 deaths.
Outlook:
The confirmed infection growth rate in the US has declined over the past 2 days substantially, which, if it continues to decline or stays at the current 22% rate could indicate many things, however, we’ll need to start tracking the numbers of tests ran per day and tests in the queue. Death rates, however, could still increase over the next 5-10 days as there is a lag between confirmed tests and deaths due to the virus taking time to run its course.
We’re still developing a way to accurately track daily testing numbers, however, we do now have a way to track active cases and the longer the US situation continues, the more relevent active cases will become. For reference, of 69,197 cases in the US, 1046 have died and 619 have recovered, which means that 98% of all US cases (ever) are still active. If the CDC’s projected 1% death rate holds true for active cases, 600-700 of these active cases would result in death over the coming days, that number would be expected to scale with the number of active cases. As the vast majority of cases are still active, we’re still primarily reporting total confirmed cases.
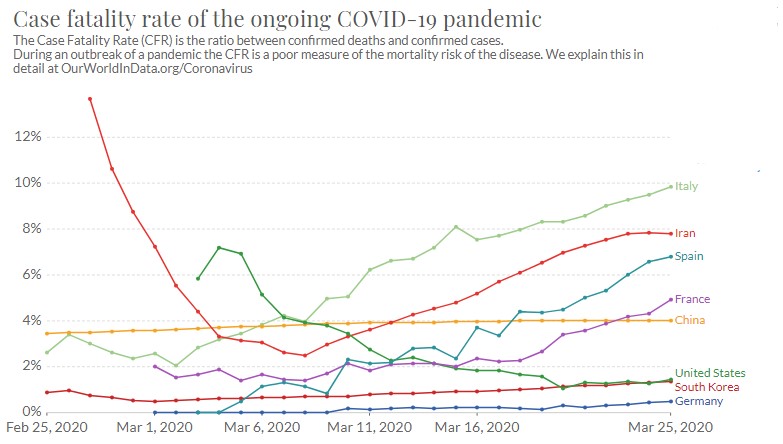
Case Fatality Rate:
The case fatality rate is determined by dividing the number of deaths by the total confirmed cases. During a pandemic, these numbers are not an accurate way to determine the true fatality rate of the disease, however these figures can still be used to track a country’s progress. A rising number may indicate that infections are not being detected until too late, or that the healthcare system is overrun. Lowering rates or steady rates could point indicate that a country has the resources to adequately treat patients. It could be affected by a number of variables as well, however, I did want to show you this chart so you could see how each country’s case fatality rate has changed over time.

This concludes this report.
If you need to contact me, please email joe @ primoweb.com or contact me on facebook at facebook.com/primoweb
Keep calm and carry on.