New confirmed infection and death totals are tabluated for 03/22.
Sources: Johns Hopkins, CDC, European CDC, and for the spotlight, The Oklahoma Department of Health. Other sources noted when used.
Terminology: “Infections” mean confirmed CONVID-19 infections. “Deaths” are deaths confirmed by CONVID-19 or complications related to the disease. “US Saturation Date” is a forward projection of the US infection rate, referring to the date in which every person in the US would have the virus, if infection rates remain the same as today. All dates refer to dates deaths or infections were reported, which may not necessarily be the date of death or infection.
For the 24 hour period of 03/22:
| Country | Rank | Growth | Infections | Prior Infections | Deaths |
| China | 1 | 0% | 81,439 | 81,346 | 3,274 |
| Italy | 2 | 10% | 59,138 | 53,578 | 5,476 |
| US | 3 | 32% | 35,206 | 26,747 | 471 |
| Spain | 4 | 13% | 28,768 | 25,496 | 1,813 |
| Germany | 5 | 11% | 24,873 | 22,364 | 94 |
| Iran | 6 | 5% | 21,638 | 20,610 | 1,685 |
| France | 7 | 12% | 16,243 | 14,485 | 676 |
| S. Korea | 8 | 1% | 8,961 | 8,897 | 111 |
| Worldwide | 10% | 339,259 | 307,278 | 307,278 |
Current US Saturation date: 04/21/20 (unchanged)
Comments & Outlook:
Italy has had 4 consecutive days of lower infection rates, while the US has had 3 days of declining rates, but Italy’s infection rates are clearly lower overall. Combine that with China’s 0% growth rate, and we’re set for the US to lead the world in total confirmed infections by Thursday 3/26, with Italy overtaking China sometime this week as well. Switzerland and the UK (not listed) are likely to be added to this list soon.
Deaths in each country seem to vary wildly and not correlate well with confirmed infections. Countries with higher death totals could be further along in the “curve”– the infection takes up to 11 days to be fatal, and potentially more time may be required to confirm the death was due to COVID-19. It is more likely that these differences reflect differences in the population age/ health, government quarantine policies, or quality/availablity of healthcare.
Perspective:
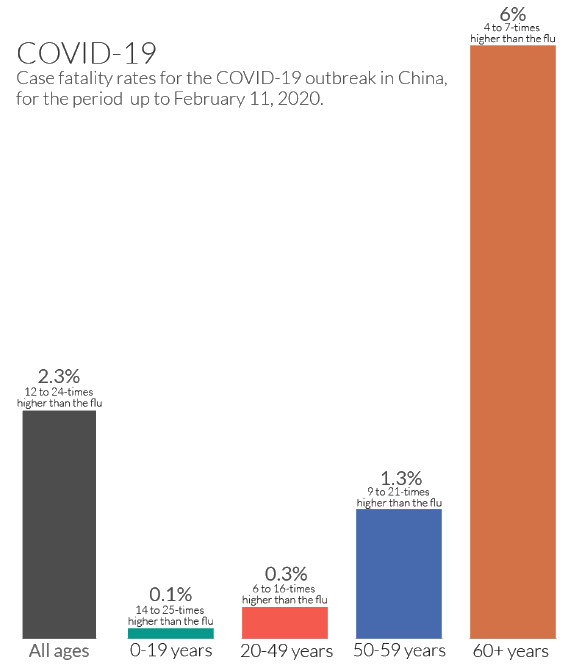
As mentioned above, the situation in each country is different. We’ll examine 3 sets of data to help gain insight into why certain countries are faring the way they are. In the first table, we’ll show the case fatality rates of different age groups as measured in China. Note: A case fatality is taking total confirmed COVID-19 deaths divided by total confirmed COVID-19 cases. The fatality rates in this chart SHOULD NOT be used to infer that the observed fatality rates will be the same in other cases. This raw data plainly shows large differences in fatality rates of different age groups.
| Age Range | COVID-19 Case Fatality Rate |
| 0-19 | 0.1% |
| 20-49 | 0.3% |
| 50-59 | 1.3% |
| 60 plus | 6.0% |
The fatality rates may look low, however, the next chart shows death rates people with a single pre-existing condition, regardless of age:
| Condition | COVID-19 Case Fatality Rate |
| Cardiovascular Disease | 10.5% |
| Diabetes | 7.3% |
| Chronic Respritory Disease | 6.3% |
| Hypertension | 6.0% |
| Cancer | 5.6% |
The next table will show a sample of countries and their percentage of population aged 70 and up.
| Country | Population over 70 | Doctors per 1000 people | Hospital beds per million people |
| China | 5.93% | 1.81 | 3.8 |
| Italy | 16.24% | 4.02 | 3.4 |
| US | 9.73% | 2.57 | 2.9 |
| Spain | 13.80% | 3.87 | 3.1 |
| Germany | 15.96% | 4.19 | 8.2 |
| Iran | 3.18% | 1.49 | 0.1 |
| France | 13.08% | 3.24 | 6.4 |
| S. Korea | 8.62% | 2.33 | No Data |
It’s impossible for me to quantify the effect of a countries health, age, and availability of doctors and hospitals affect the fatality rates, however you can clearly see that each country is different. Without providing data (for sake of time), I’ll make note that different countries also have varying rates of health conditions that could greatly affect their case fatality rates.
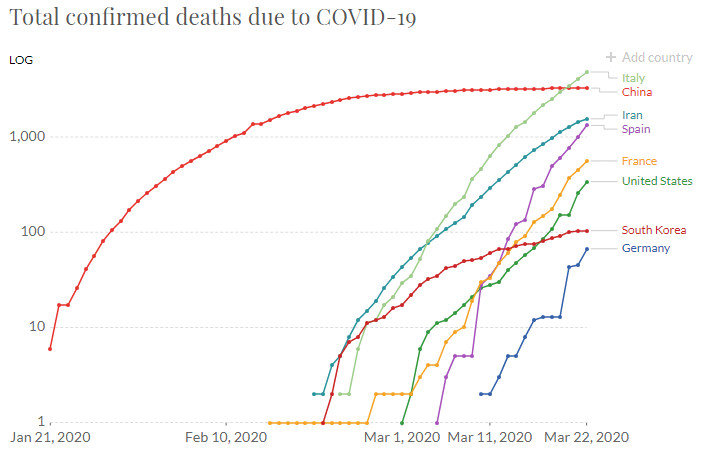
Chart:
With the perspective above, let’s examine the current death by country over time. I’ll only post the logarithmic charts in this report as they tend to provide the most readable results.
Spotlight on Oklahoma:
New numbers were obtained from the Oklahoma Department of Health. This information is the raw data I’ve obtained.
| Positive (In-State) | 67 |
| Positive (Out-of-State) | 2 |
| Negative | 669 |
| PUIs Pending Results | 102 |
| Hospitalized | 11 |
| Deaths | 2 |
Of note, that of 16% of positive positive cases (69), required hospitilization (11).
| Age Group, Years | COVID-19 Cases* |
|---|---|
| 00-04 | 2 |
| 05-17 | 0 |
| 18-49 | 31 |
| 50-64 | 21 |
| 65+ | 13 |
| Total | 67 |
| Age Range | 0-88 yrs |
They did not, in this report mention the fatalities in each age range, however the 2 total fatalities thus far in Oklahoma were both in the 50-64 age range.
| COVID-19 Cases by Gender | |
|---|---|
| Female | 34 |
| Male | 33 |
| Total | 67 |
Closing Remarks:
The information provided in this report should provide you food for thought, as well as gain a little perspective on past and future fatality rates. If you haven’t read previous reports, I highly recommend viewing the prior daily reports. Generally, I focus more on charts, projections, and trends than I did today, however, today I focused more on supporting studies to put these statistics into perspective.
If you need to get in touch with me, please email joe @ primoweb.com or find me on facebook at facebook.com/primoweb
Keep calm and carry on.