Yesterday, I moved my daily updates from Facebook to this blog. Today, we’ve got a lot to go through, so let’s get started.
US Saturation Date: 04/11/2020*** Definitely see comments section below.
As of 03/18, the new infections are as follows:
US up 47% to 9369 (from 6362) **Definitely see the comments section below
Italy up 13% to 35713 (from 31506)
Iran up 7% to 17361 (from 16169)
South Korea up 2% to 8565 (from 8413)
Worldwide infections up 10% to 218777 (from 198004)
Worldwide (excluding China & South Korea) up 19% to 129075 (from 108517)
Comments & Discussion
First and foremost, the US President held a press conference this morning, prior to this increase and the administration issued a warning. The US has a massive backlog of tests waiting to be ran, and as of today, testing speed and capability has increased by many fold. They issued guidance to ignore trends until later this week, as a massive backlog of tests are ran and cleared. Next week, these numbers will be more reflective of reality. So, in short, the numbers themselves are good, however the changes from day to day are thrown off, as is the US Saturation Date.
We’ve got more charts today, as there are some interesting visuals starting to appear beyond just the forward projections.
First, we’ll take a look at the history of infections in China vs Non-China, plus the numbers of cases that have recovered in a natural scale.
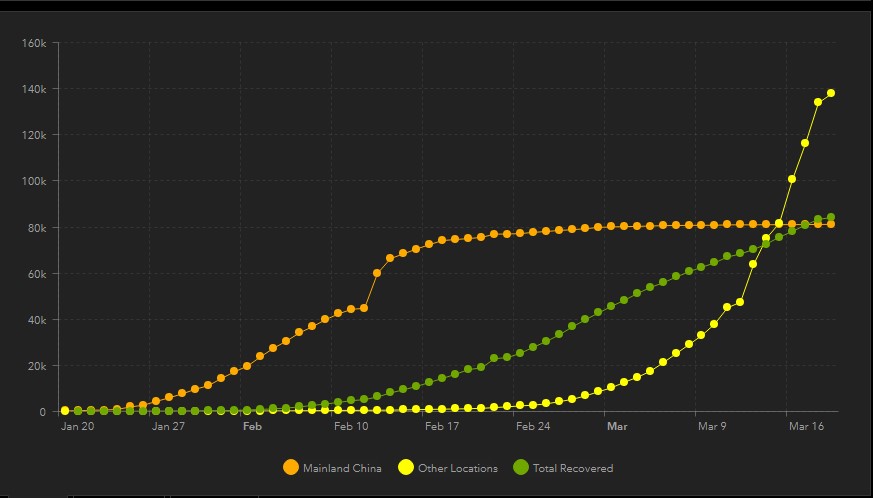
If you follow the orange line, you can see that several things stick out in the China infections. I notice how the China infections quickly grow starting in mid January. Secondly, there’s a huge “correction” (or massive growth) in mid February. Lastly, you’ll notice how, their numbers almost immediately stopped growing in mid February– literally 1 month of exponential growth, followed by no growth at all. It’s okay if you raise an eyebrow, I certainly did. One item if note is that China also reports that 91% of their total cases have either recovered (71K) or died (3K). This gives us a 4.4% fatality rate in Chinese “cleared” cases.
Turn your attention to the green and yellow lines. The green line represents total people who have recovered from COVID19 around the world. Interestingly, more people have now recovered, than ever had the disease in China. The yellow line shows that worldwide infections clearly surpass Chinese infections and are still growing exponentially (the last dot is likely artificially low due to numbers coming in late).
On to chart 2.
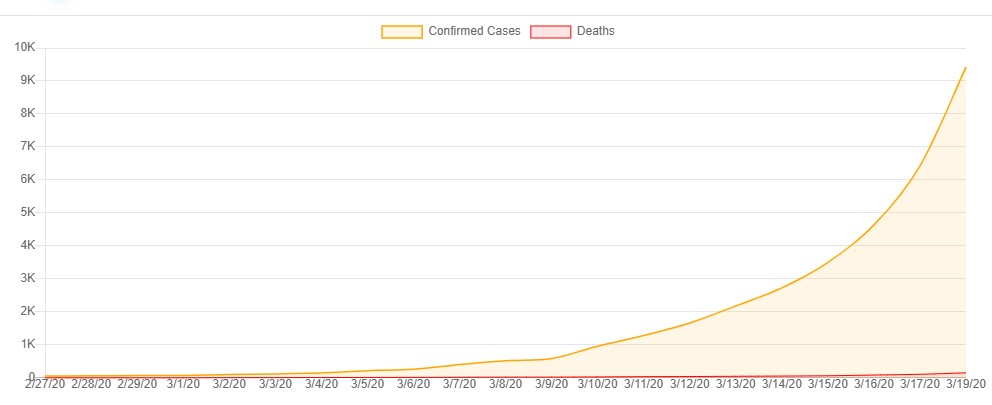 In this chart, we cover (in a natural scale) the entire history of US infections. You can easily see the steady, exponential growth of infections. The red line represents deaths, however, it’s much easier to see in a logarithmic scale.
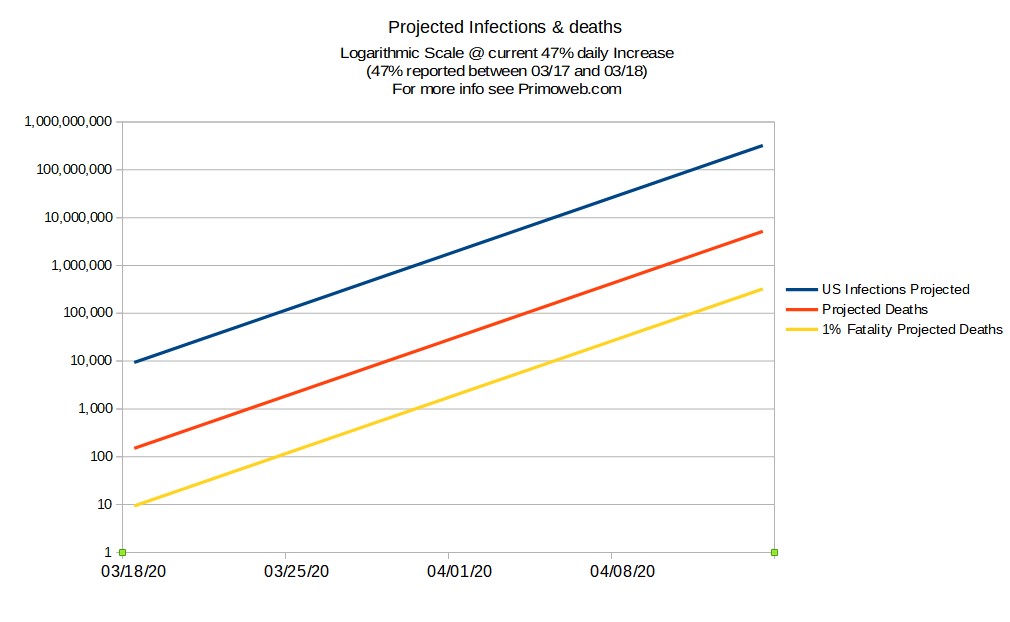
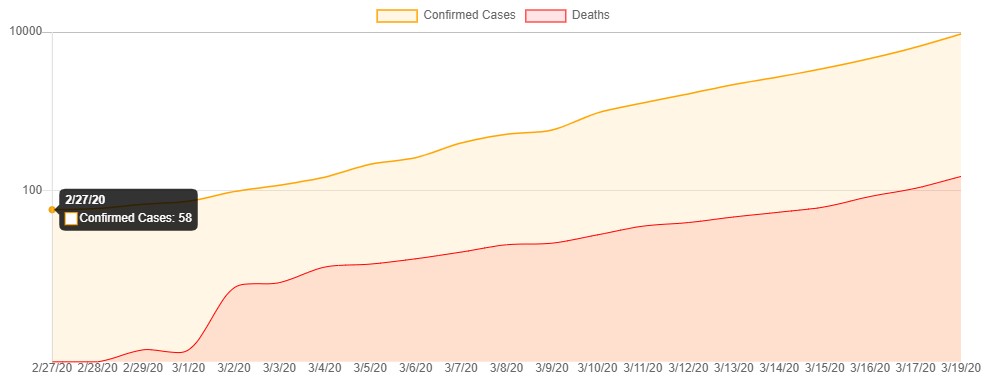 In the above chart, we see most of the history of US infections and deaths. Relatively straight lines in these logarithmic scaled charts, represent exponential growth. You can see that the slope of the death line is about 7 or more days behind the infection rates, which is understandable, as deaths are usually diagnosed a 7-14 days prior to succumbing. Interestingly, the slope of the death line matches fairly well with the infection line– which could be interpreted to mean several things, but I’l leave conjecture on that to you.
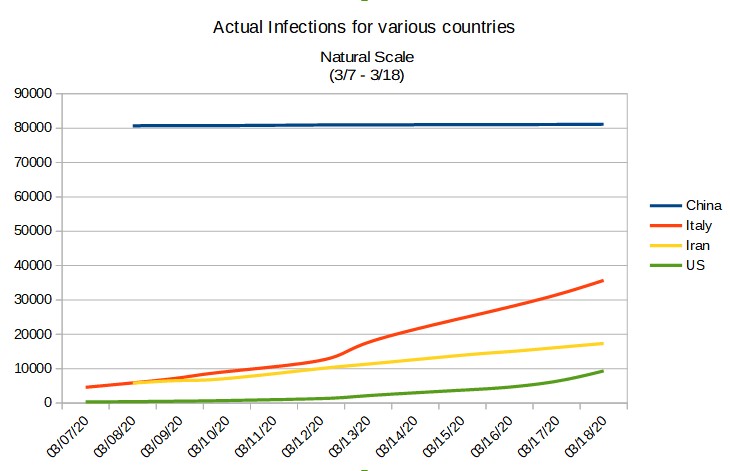
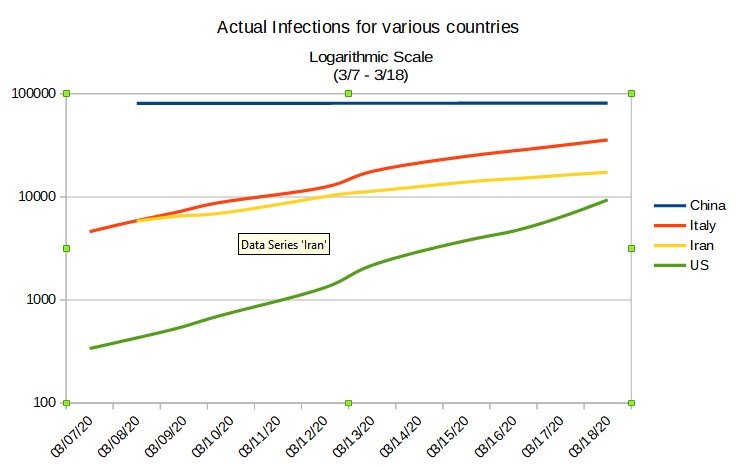
I also thought it’d be interesting to compare several countries infections over a period of time. I’ll show them in natural and logarithmic scales below. They pretty much speak for themselves.
Lastly, I’ll include my normal projections of the exponential growth in the US. As noted above, we expect these numbers to be artificially high– 40%+ growth rates likely aren’t “real” and we are told that they’re high due to a backlog of tests, finally making through a system as the capacity grows.
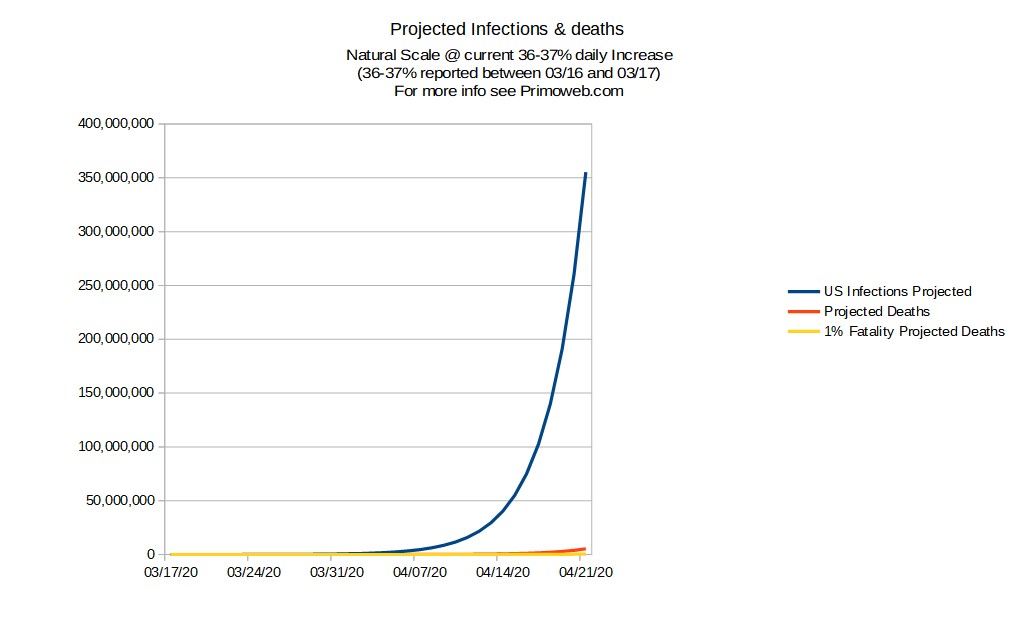
Natural Scale
 I hope the charts provided help provide some perspective on what’s going on and has gone on. If you have any questions, please hit me up at joe at primoweb.com or find me on Facebook at facebook.com/primoweb
Keep calm and carry on