This past week has brought many changes, with more quarantines and “shelter in place” orders being given worldwide. Let’s take a look at today’s new numbers, and the week overall.
In the 24 hours of 03/21, infections from around the world have increased. In the table below, “Growth” represents the change from 03/20 to 03/21. “Prior Infections” represents confirmed infections on 03/20 (yesterday).
| Country | Rank | Growth | Infections | Prior Infections |
| China | 1 | 0% | 81,346 | 81,286 |
| Italy | 2 | 14% | 53,578 | 47,021 |
| US | 3 | 36% | 26,747 | 19,624 |
| Spain | 4 | 25% | 25,496 | 20,410 |
| Germany | 5 | 13% | 22,364 | 19,848 |
| Iran | 6 | 5% | 20,610 | 19,644 |
| France | 7 | 16% | 14,485 | 12,612 |
| S. Korea | 8 | 3% | 8,897 | 8,652 |
| Worldwide | 12% | 307,278 | 275,472 |
US Saturation Date: 04/21/2020
Comments:
Overall, today’s numbers (from a growth standpoint) look much like yesterdays with the US numbers sitting right where our projections predicted they would. As expected, US jumped 2 spots in rank, surpassing both German and Spain today. South Korea reported no changes on 03/20, and we assume that today’s total represents the change over 2 days, so their growth rate today was likely 1-2% instead of the 3% reported.
US week in review:
Many communities in the US have instituted more and more restrictions on business openings and open movements. If these restrictions are successful, growth rates in the future should start to wane. The CDC also issued guidance early this week that testing was ramping up and that a backlog of unran tests would be cleared this week. This potentially could potentially cause many more cases to be ran through, with an unknown affect on numbers at this point.
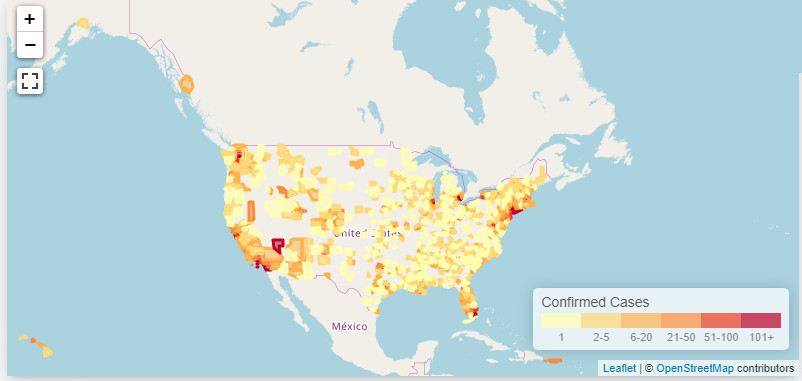
US cases, although widespread, are highly concentrated in a few areas.

In the above map you can see that all 50 states and Puerto Rico now have infections, but certain areas have much higher populations. Areas of note include the greater New York City area, Miami, Las Vegas, Las Angeles, San Deigo, San Jose, Chicago, Milwaukee, Detroit, and Seattle.
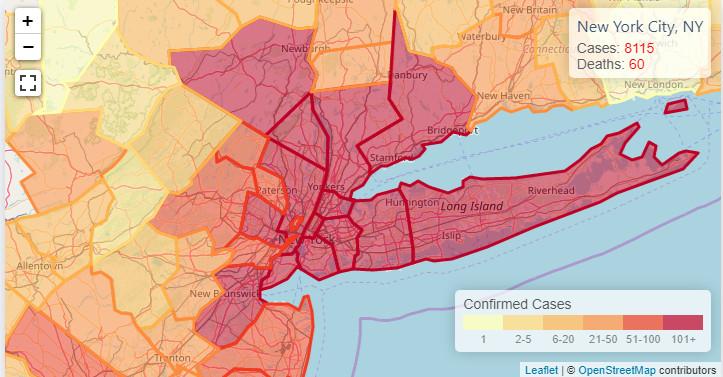
New York City and the surrounding area represents roughly 50% of total US infections. Below we show the area and show New York City cases and deaths.

In the past week: the back
US infections have increased 709% from 3,774 to 26,747
Infections worldwide have increased 81% from 168,387 to 307,278.
US deaths have increased 596% from 56 to 340.
Worldwide deaths have increased 227% from 5,761 to 13,049.
With many changes in testing volume and quarantine methods, I’ll refrain from making a larger projection, however, if the CDC did indeed get through the backlog of tests needing to be completed, projections starting next week may be more useful ,especially week over week. Sadly, from a statistical standpoint, 14 more days of data are needed to provide accurate week to week comparisons.
That will conclude our daily and weekly update for today.
Keep calm and carry on.